Author: Ramsay Capital Group

Tax Tips – IRS Provides Resources to Help Small Businesses with Taxes*

The IRS offers small business leaders helpful information on taxes.

Last year’s Tax Cuts and Jobs Act may have helped bolster revenue for many businesses, but understanding tax reform can be challenging.

Many small business owners may be able to take advantage of new 20% tax deductions on their qualified business income. To learn more, go to https://www.irs.gov/tax-reform.

The agency also provides detailed information on technical aspects of the tax law. The Tax Reform Guidance page provides a list of guides.

The drop-down articles provide some easy links to information and the Frequently Asked Questions answers common tax questions: https://www.irs.gov/newsroom/tax-reform-resources.

Publication 15, Circular E, Employer’s Tax Guide provides a more in-depth overview of employers’ tax responsibilities.

Tax Reform News has links to news articles and fact sheets about tax laws.

Other details may apply, and you can find more information on the IRS website.

* This information is not intended to be a substitute for specific individualized tax advice. We suggest that you discuss your specific tax issues with a qualified tax advisor.

Tip adapted from the IRS.gov[10]

[10] www.irs.gov/newsroom/irs-resources-can-help-small-businesses-better-understand-how-tax-reform-affects-their-bottom-line

Analyzing Data Amid Declines – WEEKLY UPDATE – NOVEMBER 19, 2018

Markets experienced more volatility last week, as perspectives on trade, tech, and retail pulled investor sentiment back and forth. Although domestic indexes were up on Friday, November 16, they still posted losses for the week.[1] In all, the S&P 500 dropped 1.61%, the Dow declined 2.22%, and the NASDAQ gave back 2.15%.[2]  International stocks in the MSCI EAFE ended the week down 1.51%.[3]

A major topic over the past couple weeks has been the ongoing, significant declines in oil prices. Last week, we did experience one turnaround – on Friday, signs that oil production may decrease next month helped oil prices start to rebound. This pricing increase contributed to S&P 500 energy stocks rising 1.1%.[4] 

In addition to oil’s current trajectory, let’s examine some of the key October data we received last week:

1. Retail Sales Beat Projections
October’s retail sales were the highest in 5 months – up 4.6% from this time last year.[5] While some of this growth comes from rebuilding efforts after the latest hurricanes, the overall data suggests that consumer spending remains strong. As a result, we may be able to expect ongoing economic growth.[6] 

2. Inflation Picked Up
The consumer price index had its largest monthly increase since the beginning of 2018. From gas to rent to cars, U.S. retail prices rose in October. Inflation is still relatively stable, however, which should mean that the Federal Reserve will continue on its current, gradual path of interest-rate increases.[7] 

3. Industrial Production Increased
Industrial production only grew by 0.1% in October, but the latest data also indicated that previous months were higher than originally thought. In fact, mining reached its highest point ever in August as production of oil and gas surged. Ultimately, this report paints a somewhat mixed picture for manufacturing: For now, output remains solid, but manufacturers have several concerns, including trade and global growth. Production has slowed since August, and we’ll now have to wait to learn whether this decline continues or rebounds.[8] 

Examined together, last week’s data may show that the economy still has strength, but questions remain. We will continue to monitor these and many other reports to help gain a clearer perspective on what may lie ahead.

As we look to this week, we want to take a moment to say thank you for being one of our valued clients. We recognize the trust you place in our team and are thankful for your relationship during this holiday – and every week of the year.

[1] www.bloomberg.com/news/articles/2018-11-15/asia-stocks-to-track-u-s-gain-brexit-slams-pound-markets-wrap?srnd=markets-vp

[2] www.reuters.com/article/us-usa-stocks/sp-dow-advance-on-trade-optimism-nvidia-sinks-nasdaq-idUSKCN1NL1K9

http://performance.morningstar.com/Performance/index-c/performance-return.action?t=SPX®ion=usa&culture=en-US

http://performance.morningstar.com/Performance/index-c/performance-return.action?t=!DJI®ion=usa&culture=en-US

http://performance.morningstar.com/Performance/index-c/performance-return.action?t=@CCO

[3] www.msci.com/end-of-day-data-search

[4] www.reuters.com/article/us-usa-stocks/sp-dow-advance-on-trade-optimism-nvidia-sinks-nasdaq-idUSKCN1NL1K9

[5] www.ftportfolios.com/Commentary/EconomicResearch/2018/11/15/retail-sales-rose-0.8percent-in-october

[6] www.cnbc.com/2018/11/15/us-retail-sales-oct-2018.html

[7] www.marketwatch.com/story/consumer-inflation-posts-biggest-jump-in-nine-months-on-higher-cost-of-gas-rent-used-cars-cpi-shows-2018-11-14

[8] www.marketwatch.com/story/industrial-production-inches-up-in-october-as-fed-finds-record-mining-output-2018-11-16

Tax Tips – 100% Depreciation Deduction Benefit for Business Taxpayers*

If you’re a business owner, you can reap the benefits this year of changes in the tax code enacted in December 2017. You can write off most of your depreciable business assets in the year the assets were used.

Here is what you need to know about the new deductions:

  • Business assets with 20-year recovery periods or less may be eligible.
  • Machinery, equipment, computers, appliances, and furniture may qualify for the deduction.
  • Only property that was acquired and put in use after September 27, 2017 qualifies.
  • Eligible property must be included on a return filed on time. Certain exceptions may apply.

The IRS provides information on the types of property that qualifies for the deductions. For more information, go to https://www.gpo.gov/fdsys/pkg/FR-2018-08-08/pdf/2018-16716.pdf.

Other details may apply, and you can find more information on the IRS website.

* This information is not intended to be a substitute for specific individualized tax advice. We suggest that you discuss your specific tax issues with a qualified tax advisor.

Tip adapted from IRS.gov[18]

[18] www.irs.gov/newsroom/new-100-percent-depreciation-deduction-benefits-business-taxpayers

The Impact of Oil and Elections – WEEKLY UPDATE – NOVEMBER 12, 2018

Last week, markets experienced a 4-day winning streak before dropping on Friday, November 9. Despite those losses, domestic indexes posted gains for the week.[1] The S&P 500 increased 2.13%, the Dow added 2.84%, and the NASDAQ was up 0.68%.[2] International stocks in the MSCI EAFE had slight growth, ending the week up 0.20%.[3]

From interest rates to corporate profits, investors had a number of topics to consider.[4] In this update, we want to focus on two key details that drove markets: oil prices and midterm election results.

1. Oil Prices Declined
Oil prices continued to fall last week, posting the most consecutive daily declines in at least three decades.[5] In fact, West Texas Intermediate (WTI) futures, a key oil benchmark, is officially in bear market territory. WTI has fallen more than 20% below its highest point over the past year.[6]  

What does this drop mean for markets?
Some investors believe the price declines are another sign that the global economy is slowing down. Historically, people have used oil prices as one way to decipher economic health because they can correlate with global growth. When crude oil prices drop, greater economic challenges are often ahead.[7] 

This recent decline may have a less concerning explanation. The United States sanctioned Iran last week while allowing eight nations to continue buying oil from the country for now.[8] All of these waivers resulted in 1 million more barrels of Iranian oil being on the market than expected, the opposite of the anticipated tightening supply.[9]  

Bottom line: The oil price decline may be more of a symptom of disrupted supply and demand, rather than an indication of the global economy’s health.[10]  

2. Midterm Elections Brought Few Surprises
The long-awaited midterm elections occurred last week, and the results matched expectations for a split Congress.[11] These results contributed to the midweek market rally we experienced.[12]  

How could the results affect markets?
Post-midterm market results are generally strong. Over the past 18 midterm elections, stocks have always had positive returns from their lows in October to the year’s end. Some investors even believe that October’s struggles were a sign of the markets pricing in the election results about a month early.[13]   

Taking a historical, long-term view, the current arrangement of a Republican president and a split Congress has resulted in 12% annual returns since 1936. The chart below shows how markets have performed through each potential party-control scenario.[14]
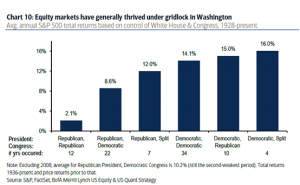
 

Although stocks have often done well when Washington experiences gridlock, the current scenario also makes a government shutdown or increased investigations into President Trump more likely. With either of these actions, market volatility could follow.[15]

Bottom line: The election results could help bolster market performance. The split Congress also brings potential for political uncertainty that increases volatility for investors.[16]

In many ways, this week’s market behavior underscores the complex, interconnected relationships between geopolitics and the markets. If you have any questions or would like to dive deeper into how these situations affect your financial life, we’re here to talk.

[1] www.marketwatch.com/story/dow-looks-set-to-sink-by-triple-digits-after-fed-update-as-oil-extends-fall-2018-11-09?dist=markets

[2] http://performance.morningstar.com/Performance/index-c/performance-return.action?t=SPX®ion=usa&culture=en-US

http://performance.morningstar.com/Performance/index-c/performance-return.action?t=!DJI®ion=usa&culture=en-US

http://performance.morningstar.com/Performance/index-c/performance-return.action?t=@CCO

[3] www.msci.com/end-of-day-data-search

[4] www.cnbc.com/2018/11/09/stock-market-us-futures-lower-after-fed-decision.html

[5] www.reuters.com/article/us-usa-stocks/oil-slide-china-worries-send-wall-street-tumbling-idUSKCN1NE1GQ

[6] www.cnbc.com/2018/11/09/stock-market-us-futures-lower-after-fed-decision.html

www.investopedia.com/terms/w/wti.asp

[7] www.marketwatch.com/story/stock-market-investors-wrestle-with-a-glut-of-bearish-signs-as-oil-prices-plunge-2018-11-10

[8] www.reuters.com/article/us-usa-stocks/oil-slide-china-worries-send-wall-street-tumbling-idUSKCN1NE1GQ

[9] www.marketwatch.com/story/stock-market-investors-wrestle-with-a-glut-of-bearish-signs-as-oil-prices-plunge-2018-11-10

[10] www.marketwatch.com/story/stock-market-investors-wrestle-with-a-glut-of-bearish-signs-as-oil-prices-plunge-2018-11-10

[11] www.bloomberg.com/news/articles/2018-11-07/this-time-stocks-got-it-right-now-about-that-october-rout

[12] www.cnbc.com/2018/11/09/stock-market-us-futures-lower-after-fed-decision.html

[13] www.bloomberg.com/news/articles/2018-11-07/this-time-stocks-got-it-right-now-about-that-october-rout

[14] www.cnbc.com/2018/11/05/market-history-shows-investors-should-hope-for-gridlock-on-election-day.html

[15] www.cnbc.com/2018/11/05/market-history-shows-investors-should-hope-for-gridlock-on-election-day.html

[16] www.cnbc.com/2018/11/05/market-history-shows-investors-should-hope-for-gridlock-on-election-day.html

Tax Tips – What Do the Different Filing Statuses Mean?*

What are you? That may sound like a trick question, but we’re talking taxes. The IRS provides five different filing statuses: single, married filing jointly, married filing separately, head of household, or qualifying widow(er) with dependent child.

You can only choose one, right? No, not necessarily.

Is it important which filing status you claim? Yes, it’s very important. Your status will determine how much taxes you’ll have to pay.

Ideally, you should choose a category that allows you to pay the least amount in taxes.

So, what do the different categories mean, and which one should you choose?

  • Single: Use this if you are not married or are divorced or legally separated under your state law.
  • Married filing jointly: If you’re married, you can file a joint return with your spouse. If your spouse dies, you can file in this category during the year of your spouse’s death.
  • Married filing separately: If you’re married, you may file two separate returns. This may allow you to pay less taxes. However, if you’re interested in this option, you should try preparing your taxes both jointly and separately (before filing) to determine which one allows you to pay less taxes. This may also work if both you and your spouse want to retain individual responsibility for each own’s taxes.
  • Head of household: You may use this filing status if you’re not married (in most cases). The IRS has special rules for using this one; you may use this if you paid more than half of the costs for upkeeping the home where you and a qualifying person live.
  • Qualifying widow(er) with dependent child: You can use this status if your spouse died in the previous two years and you have a dependent child.

Check the IRS rules carefully to determine your filing status: https://www.irs.gov/help/ita/what-is-my-filing-status.

Other details may apply, and you can find more information on the IRS website.

* This information is not intended to be a substitute for specific individualized tax advice. We suggest that you discuss your specific tax issues with a qualified tax advisor.

Tip adapted from IRS.gov[12]

[12] www.irs.gov/newsroom/here-are-facts-to-help-taxpayers-understand-the-different-filing-statuses

Markets Bounce Back – WEEKLY UPDATE – NOVEMBER 5, 2018

Markets posted strong gains last week after struggling for much of October. The S&P 500 had its best weekly performance since May, and the NASDAQ had its first positive week since September.[1] Despite domestic markets dropping on Friday, November 2, the S&P 500 added 2.42%, the Dow increased 2.36%, and the NASDAQ gained 2.65%.[2] International stocks in the MSCI EAFE were also up 3.34%.[3]

What drove market performance last week?
We received a fair amount of data and reports, with the following details holding particular weight for investors:

  • U.S. – China trade updates were inconsistent.
    Stocks fluctuated widely on Friday, in large part because of contradictory updates on a potential trade deal between the U.S. and China. President Trump said the two countries are a lot closer to an agreement. Larry Kudlow, Trump’s economic advisor, shared a different perspective, indicating the U.S. is not working out a trade deal with China. These conflicting reports contributed to volatility in the markets as investors tried to determine exactly where we stand. [4]                                                         
  • U.S. corporate earnings were strong but imperfect.
    So far, the 3rd quarter earnings season has been a strong one. Of the 74% of S&P 500 companies that have released their data, 78% have beaten their earnings-per-share estimates, and earnings have grown 24.9% year-over-year.[5] However, concerns for at least one major tech company’s projections affected investor behavior.[6] In addition, analysts predict that in 2019, earnings growth will not match the double-digit results we’ve experienced this year. [7]
  • Labor market growth beat expectations.
    The economy added 250,000 jobs in October, a stronger increase than expected. Wages also rose, posting 3.1% growth over the prior year, the fastest annual growth since 2009.[8] Investors interpreted these results to mean that the Federal Reserve would continue raising interest rates at its projected pace.[9]


Where should you go from here?  

If you felt at all whipsawed by last week’s price fluctuations, especially after October’s declines, you weren’t alone. Even if you know that market volatility is normal, it can feel intense in the moment. Right now, many investors are also jumping in and out of popular, crowded stocks, causing market levels to shift more quickly than many people are used to. To navigate these accelerated changes, you need to remove emotion from investing decisions and stick to your long-term vision even more.[10] 

Rather than trying to predict what stocks will do in the immediate future, we are here to help you plan for the financial life and legacy you desire. Please let us know if you have any questions about where you are and how to pursue your future.

[1] www.bloomberg.com/news/articles/2018-11-01/asia-stocks-to-extend-rally-after-trump-xi-call-markets-wrap?srnd=markets-vp

[2] www.marketwatch.com/story/dow-aims-for-4th-gain-in-a-row-ahead-of-jobs-report-apples-stock-sinks-on-outlook-2018-11-02?dist=markets

http://performance.morningstar.com/Performance/index-c/performance-return.action?t=SPX®ion=usa&culture=en-US

http://performance.morningstar.com/Performance/index-c/performance-return.action?t=!DJI®ion=usa&culture=en-US

http://performance.morningstar.com/Performance/index-c/performance-return.action?t=@CCO

www.cnbc.com/2018/11/02/stock-market-triple-digit-gains-for-dow-nonfarm-payrolls.html

[3] www.msci.com/end-of-day-data-search

[4] www.cnbc.com/2018/11/02/stock-market-triple-digit-gains-for-dow-nonfarm-payrolls.html

[5] www.factset.com/hubfs/Resources%20Section/Research%20Desk/Earnings%20Insight/EarningsInsight_110218.pdf

[6] www.cnbc.com/2018/11/02/stock-market-triple-digit-gains-for-dow-nonfarm-payrolls.html

[7] www.factset.com/hubfs/Resources%20Section/Research%20Desk/Earnings%20Insight/EarningsInsight_110218.pdf

[8] www.ftportfolios.com/Commentary/EconomicResearch/2018/11/2/nonfarm-payrolls-rose-250,000-in-october

[9] www.bloomberg.com/news/articles/2018-11-01/asia-stocks-to-extend-rally-after-trump-xi-call-markets-wrap?srnd=markets-vp

[10] www.bloomberg.com/news/articles/2018-11-02/bulls-sit-still-as-u-s-stock-reversals-land-with-record-force?srnd=markets-vp

Tax Tips – Tax Preparers Should Watch for Signs of Information Theft*

If you’re a tax preparer or professional, how do you detect theft? What are the subtle signs that indicate information has been stolen?

The IRS has joined forces with Security Summit to combat information and identify theft. State tax agencies, tax preparation firms, software developers, payroll and tax financial product processors, tax professional organizations, and financial institutions are part of Security Summit.[9] 

Tax preparers may be unaware of client data theft until they discover fraudulent tax returns being filed in their clients’ names. Safety experts urge preparers to protect client information by implementing strong security protections.

Here are some red flags for tax preparers of possible data theft:

  • The IRS begins to reject clients’ e-filed returns because a tax return with the same Social Security number has already been filed.
  • The IRS sends authentication letters to clients who haven’t filed returns. The letters include forms 5071C, 4883C, and 5747C.
  • The IRS sends refunds to clients who haven’t filed returns.
  • The IRS sends tax transcripts to clients who haven’t requested them.
  • The IRS sends notices to clients who have created online services accounts that their accounts were accessed.
  • The number of returns you filed with your Electronic Filing Identification Number is greater than the number of clients you have.
  • You are getting responses to emails you either didn’t send or don’t recall sending.

Other details may apply, and you can find more information on the IRS website.

* This information is not intended to be a substitute for specific individualized tax advice. We suggest that you discuss your specific tax issues with a qualified tax advisor.

Tip adapted from IRS.gov[10]

[10] www.irs.gov/newsroom/tax-preparers-should-look-out-for-these-signs-that-a-criminal-stole-information

Why Did Stocks Drop? – WEEKLY UPDATE – OCTOBER 29, 2018

Last week did nothing to dispel October’s reputation as a tough month for the markets. The S&P 500 lost 3.94%, the Dow declined 2.97%, and the NASDAQ dropped 3.78% during what was one of 2018’s most volatile weeks so far. All three indexes are down significantly for the month, and both the S&P 500 and Dow have entered negative territory for 2018.[1] International stocks in the MSCI EAFE also struggled, posting a 3.87% drop for the week, and a 13.31% decline for the year.[2]

Why did stocks drop? Will they continue to do so?
Currently, many topics are on investors’ minds, from inflation to tariffs to valuations and beyond, but analysts are not pointing to one single culprit for last week’s performance. Instead, a mixture of concerns, with a large dose of emotion, seemed to drive the markets.[3] 

Emotional reactions are understandable when volatility emerges, but they have no place in long-term investment strategies. Instead, we need to focus on the fundamentals.

What did we learn last week?
Trying to find simple explanations for market behavior can feel impossible, in part because the markets aren’t a machine – they’re a reflection of many human actions. Investors make choices based on their interpretations of current conditions, and the effects of these decisions become “market performance.”

Amidst the volatility, we received several updates on the economy, including:

  • 3rd Quarter Gross Domestic Product (GDP) beat expectations: The initial GDP reading for the 3rd quarter came in at a strong 3.5%, helped in large part by consumer spending.[4]
  • Corporate earnings have been strong, but imperfect: So far, this corporate earnings season is showing 22% growth, but fewer S&P 500 companies are exceeding analysts’ predictions than in the 1st quarter of 2018. In particular, some major tech companies’ results disappointed investors.[5]
  • Housing continued to struggle: New home sales were lower than expected in September, which followed disappointing results from existing-home sales data, as well.[6]
  • Inflation growth eased: The Personal Consumption Expenditures Price Index, which shows inflation, increased by 1.6% in the 3rd quarter, much lower than projected.[7] 

Examined together, this data indicates that while the economy has potential challenges, it also demonstrates solid growth, reasonable inflation, and strong corporate performance. That story feels different than the sharp drop we experienced last week.

However, when you look at the bigger picture, our current circumstances provide another reminder that volatility is normal, and examining economic fundamentals is critical.

Still, risks exist, and in the coming weeks we will pay very close attention to data and performance. In particular, we will follow the Federal Reserve’s comments and actions to see what may lie ahead for interest rates. In the meantime, please let us help answer your questions and address your concerns. We are here to help you pursue your goals, in every market environment.

[1] http://performance.morningstar.com/Performance/index-c/performance-return.action?t=SPX®ion=usa&culture=en-US

http://performance.morningstar.com/Performance/index-c/performance-return.action?t=!DJI®ion=usa&culture=en-US

http://performance.morningstar.com/Performance/index-c/performance-return.action?t=@CCO

www.bloomberg.com/news/articles/2018-10-25/asia-stocks-set-to-rally-on-u-s-gains-bonds-slip-markets-wrap?srnd=markets-vp

www.cnbc.com/2018/10/26/stock-market-us-futures-show-drop-for-dow.html

[2] www.msci.com/end-of-day-data-search

[3] https://www.bloomberg.com/news/articles/2018-10-25/sell-offs-are-normal-but-this-week-is-shocking-the-pros

[4] http://wsj-us.econoday.com/byshoweventfull.asp?fid=485684&cust=wsj-us&year=2018&lid=0&prev=/byweek.asp#top

[5] www.reuters.com/article/us-usa-stocks-weekahead/mixed-u-s-inflation-signals-leave-investors-adrift-idUSKCN1N01F6

[6] wsj-us.econoday.com/byshoweventfull.asp?fid=485959&cust=wsj-us&year=2018&lid=0&prev=/byweek.asp#top

[7] www.cnbc.com/2018/10/26/first-read-on-us-q3-2018-gross-domestic-product.html

Tax Tips – Use the Paycheck Checkup if You Have Other Sources of Income*

If you’re working for an employer and have other income sources outside your job, you should get a Paycheck Checkup. For more information, go to https://www.irs.gov/newsroom/time-for-a-paycheck-checkup.

Doing a paycheck checkup with the Withholding Calculator may help you avoid paying taxes at tax filing time. Go to https://apps.irs.gov/app/withholdingcalculator/.

Other income sources may come, for example, from the exchange of products and services in a sharing economy, interest, dividends, self-employment, capital gains, prizes, or awards.

Taxpayers may find the calculator especially important this year in the wake of changes to the tax code from the Tax Cuts and Jobs Act.

Here are some items to consider if you’re thinking about changing your withholdings to avoid a tax bill:

  • You should pay at least 90% of your income tax through withholding.
  • You can use Form W-4 to make adjustments to your income if the Withholding Calculator estimates you will have to pay taxes. Go to https://www.irs.gov/pub/irs-pdf/fw4.pdf.
  • If you’re generating income from other sources, you can still reduce or eliminate the possibility you’ll pay taxes by claiming fewer withholding allowances on your Form W-4.
  • You may also request your employer withhold an additional amount of money from your paycheck if you anticipate having to pay taxes at filing.
  • If you have to make additional tax payments through your paycheck, you may use Form 1040-ES, Estimated Tax for Individuals, to calculate an appropriate amount. Go to https://www.irs.gov/pub/irs-pdf/f1040es.pdf.

For additional questions, go to https://www.irs.gov/payments.

Other details may apply, and you can find more information on the IRS website.

* This information is not intended to be a substitute for specific individualized tax advice. We suggest that you discuss your specific tax issues with a qualified tax advisor.

Tip adapted from IRS.gov[12]

[12] www.irs.gov/newsroom/employees-with-other-sources-of-income-should-do-a-paycheck-checkup

Examining October – WEEKLY UPDATE – OCTOBER 22, 2018

Stock performance was mixed last week as investors considered the impact of interest rates, international affairs and corporate earnings.[1] The S&P 500 gained 0.02%, and the Dow added 0.41% to post its first weekly gains in October. The NASDAQ declined 0.64% and extended its losing streak.[2] International stocks in the MSCI EAFE dropped by 0.08%.[3]

While the final weekly results showed relatively little growth or loss, the week included some volatility.[4] So far, domestic indexes have struggled this month. As of October 19, the S&P 500 and Dow had each lost more than 3% for the month, and the NASDAQ was down 7%.[5] 

As we have often discussed in our market updates, volatility may feel uncomfortable, but market fluctuations are normal. That perspective becomes especially relevant in October, which is considered the most volatile month for markets.[6] 

Examining October History

Historical performance can’t predict future results. However, we do believe that understanding what makes October unique can help provide context for the current environment.

Significant market events

For generations, many of the most significant market events have taken place in October, including the crash of 1929 and multiple large drops in 2008. In addition, last Friday, October 19, marked the 31st anniversary of the “Bloody Monday” market crash. On that date in 1987, the S&P 500 lost over 20% of its value.[7] 

Higher than normal volatility
Since 1950, the S&P 500 has experienced more 1% moves in October than any other month.[8] The month has also been the Dow’s most volatile since its beginning in 1896.[9] 

Surprising performance
Despite the large events and high volatility that October can bring, its results may be stronger than expected. For the past 20 years, October has had the strongest performance of any month.[10] 

Exactly how this month will end remains to be seen, as we still have a few trading days left. But we hope that understanding how much markets often move in October will help you ride out any future volatility with more confidence. Of course, we’re also here to provide any answers or information you need, so contact us any time.

[1] www.cnbc.com/2018/10/19/wall-street-futures-point-to-a-slight-rebound-after-the-dow-sheds-300-points.html

[2] www.cnbc.com/2018/10/19/wall-street-futures-point-to-a-slight-rebound-after-the-dow-sheds-300-points.html

http://performance.morningstar.com/Performance/index-c/performance-return.action?t=SPX®ion=usa&culture=en-US

http://performance.morningstar.com/Performance/index-c/performance-return.action?t=!DJI®ion=usa&culture=en-US

http://performance.morningstar.com/Performance/index-c/performance-return.action?t=@CCO

[3] www.msci.com/end-of-day-data-search

[4] www.cnbc.com/2018/10/19/wall-street-futures-point-to-a-slight-rebound-after-the-dow-sheds-300-points.html

[5] www.cnbc.com/2018/10/19/wall-street-futures-point-to-a-slight-rebound-after-the-dow-sheds-300-points.html

[6] www.marketwatch.com/story/fasten-your-seat-belt-october-is-almost-here-2018-09-25

[7] www.cnbc.com/2018/10/15/this-chart-shows-why-october-has-such-a-scary-reputation-on-wall-street.html

www.marketwatch.com/story/dow-poised-to-jump-100-points-at-the-open-as-stock-market-aims-to-follow-china-rebound-2018-10-19?dist=markets

[8] www.cnbc.com/2018/10/15/this-chart-shows-why-october-has-such-a-scary-reputation-on-wall-street.html

[9] www.marketwatch.com/story/should-investors-fear-october-a-historic-jinx-month-for-stocks-2018-09-26

[10] finance.yahoo.com/video/ryan-detrick-markets-210928786.html?format=embed